
지난 1월13일에 한국예술종합학교 대학로 대강당에서 유튜브라이브로 한국예술영재교육연구원에서 주최한 2022 KRIGA 국제심포지움에서 ‘데이터, AI에 대한 예술적 접근’이라는 주제로 강연과 공개 Q&A토론을 하면서 현 시점에 있어 예술교육에 대한 고민을 함께 나누었다.

Solo Exhibition, Younghui Kim
Gallery White Birch, Seoul: June 3rd – 13th, 2021

삶의 순간순간을 겹겹의 레이어로 바라 본 작품 안에서는 삶 속에서 변화없이 반복되는 일상과 그렇지 않은 순간을 명확히 드러낸다. 이번 개인전 [ 겹겹 ]의 작업을 통해 작가는 공간 속에 쌓이는 겹겹의 시간돠 흔적들을 데이터로 그리면서 자신을 스쳐간 기억들을 마주한다. 호주에서의 일상이었던 굿윌 (Goodwill)다리와 쿠맆라(Kurilp)다리를 건너며 하루 한 장씩 작가의 시점에서 기록한 사진을 겹겹의 레이어로 쌓아 올려 시간을 압축하여 바라봄으로써 변하거나 돌출된 삶의 순간을 노출시켰다. 또한 지난 10년 간 사고의 순간들을 기록한 소셜 미디어 글을 통해 생각의 반복과 반복되지 않은 다양성을, 그리고 일상 속 부딪힘이라는 물리적 충격 데이터를 활용하여 겹겹의 시간을 한 순간의 각으로 관통해 바라보았다. 2021.05.25 작가의 말.
아래 전시작품 슬라이드 Artwork Pages from the exhibition leaflet 2021
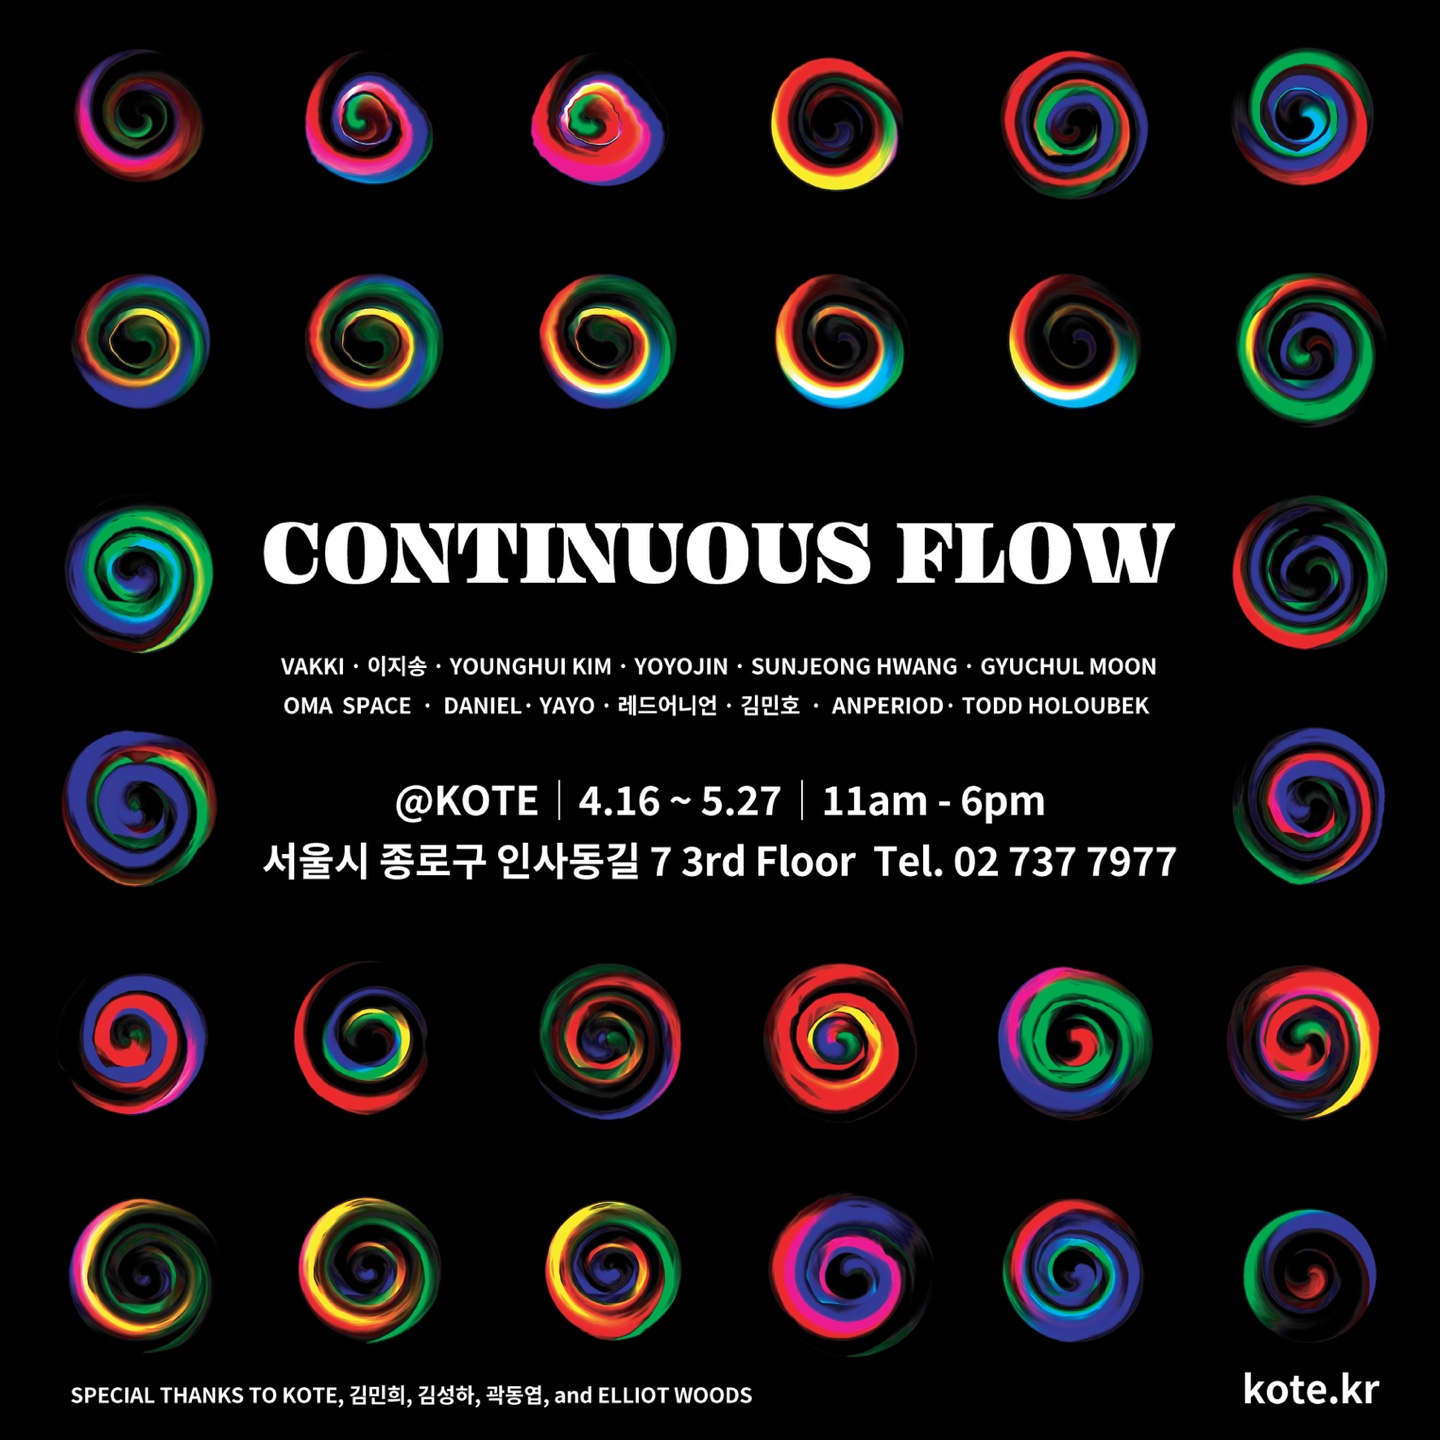
Continuous Flow – April 16-May 27 2021, at KOTE 3F Gallery
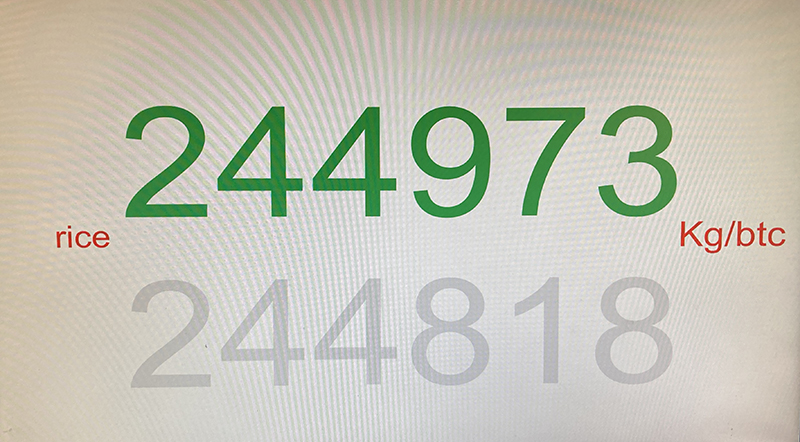
KOTE is an amazing art & culture space located in the heart of Seoul, Insadong. On the 3F gallery, curated with Todd Hollebeck & Minhee Kim, 5 solo exhibitions and 2 group exhibitions among 13 individual or team artists who deals with art, media, and technology. Younghui has participated in this evolving exhibition with her new artworks: “Bridge Crossing – Kurilpa 2021” with, “RICE-1Kg – new version 2021” in the 3rd FL gallery, Room 3 as a Solo-exhibition.
more info at KOTE


from top in clockwise: Mungkot by Marie Kim (Younghui Kim), Gidojadeul by Jin K. Lee, Alice in Wonderland Seoul by Alice Achoo, BoTree by Sam An, and Today’s Practice by Jeesun Lucia Lee. All Rights Reserved by the artists. Copyrights 2020.
Plug-In City Project, curated and produced by RedOnion 2020 and sponsored by Ministry of Culture, Sports and Tourism, Arts Council Korea, and Seoul Foundation of Arts and Culture.
Participating artists: Younghui Kim, Sam An, Alice Achoo, Soyoung You, Jaemin Lee, Lucia Jeesun Lee, Jin K Lee
The off-line exhibition of the art project Plug-In City – Seoul 2020 was held quietly at the gallery B2Project (Dec 24-31 2020) as a closure to the year 2020. To demonstrate of the curatorial concept of the data artwork visiting various screen displays at home, office, or cafe, we set up the gallery with vintage furniture provided by B2Project. More info at: http://www.b2project.co.kr/product/detail_portfolio.html
Younghui has co-founded an art & tech group, RedOnion with Sam An. Plug-In City is their first art project that promotes artistic use of Seoul data live. They technically collaborated with 7 artists to work with the live data in their artmaking. Last December 2020, the artists’ final outputs are exhibited online in a special format of the screen saver and wordpress plug-in for the time of untact situation. The description of Plug-In City (Seoul 2020) is below.

On the 22nd of December, seven artworks plug-in with Seoul data.
Wherever you are, you can turn your space into a gallery. These artworks visit your sleeping displays, dreaming of Seoul. We invite you to <Plug-In City Seoul 2020>, the very first experimental online group exhibition produced by RedOnion. Seven artists present artworks driven by different live data of Seoul. Some of them are inspired by Seoul’s real estate, daily bumping, yoga with solar/lunar cycle, and suicide rate and air pollution data. Some imagine the taste of data and some reminisce dreamlike Seoul.
In participation ART MUST GO ON project funded by Ministry of Culture, Sports and Tourism, Arts Council Korea, and Seoul Foundation of Arts and Culture, this exhibition went live on plugincity.org. This exhibition is in the format of WordPress Plug-in and screensaver (Mac only for now) and downloadable at the site. Screensaver for Windows is coming soon so please follow us on Facebook and Instagram
Artists: Younghui Kim*, Sam An, Alice Achoo, Soyoung You, Jaemin Lee, Lucia Jeesun Lee, Jin K Lee
Producer: RedOnion
Sponsors: Ministry of Culture, Sports and Tourism, Arts Council Korea, Seoul Foundation of Arts and Culture
*Younghui’s new artwork, ‘Mungkot 멍꽃’ was created through this project and she used her sub name, Marie Kim 마리킴 for this exhibition.
서울에 플러그인된 7개의 작품…
도시와 함께 살아 움직이는 예술을 꿈꾸는 레드어니언의 온라인 실험기획전, 문화체육관광부, 한국문화예술위원회, 서울문화재단의 ART MUST GO ON 지원 사업으로 진행되는 <Plug In City – Seoul >로 당신을 초대합니다. 잠시 마우스를 내려놓고 작품을 감상하거나 스크린 세이버를 컴퓨터에 설치하여 휴식시간 예술을 향유하는 온라인 전시, 생활 구석구석 퍼져 있는 다양한 화면 속으로 도시의 실시간 데이터에 의해 지속적으로 변화하는 작품이 들어와, 당신이 머무는 일상 속 그곳이 갤러리가 됩니다. 스크린세이버와 플러그인 포맷으로 전시되는 이 프로젝트는 7명의 참여작가가 서울을 중심으로 한 부동산 이야기, 일상적 부딪힘, 해와 달 주기- 하타요가, 데이터맛, 자살과 미세먼지의 관계, 꿈같은 서울, 재난과 기일을 주제로 7개의 데이터 아트 작품을 새로 창작해 선보입니다.
예술단체 레드어니언는 다양한 예술영역의 작가들에게 라이브 데이터 융합 기술을 제공하며 협업을 지속적으로 하고 있습니다. 레드어니언은 Plug-In City 프로젝트를 통해 다양한 도시를 중심으로 한 실시간 데이터 융합 작품을 스크린세이버와 플러그인 등을 통해 지속적으로 제공해 나갈 것입니다.
참여작가 : 김영희, 안샘, 앨리스 아추, 유소영, 이재민 , 이지선, 진케이리
주관 : 레드어니언
후원 : 문화체육관광부, 한국문화예술위원회, 서울문화재단
이 온라인 예술활동의 결과물은 문화체육관광부, 한국문화예술위원회, 서울문화재단의 기금을 지원받아 제작되었습니다.
Venue: Korean Design Institute of Promotion, Seoul Nov 19th – Dec 18 2020.
As the main theme exhibition of DK Festival (Design Korea Festival), Design Beyond Data, Younghui’s revised artwork, BreatheOut 2020 – Live data-driven screen and wearable artworks participated in this big Design Korea festival. It symbolizes 50 years of Design Korea and I was quite honored to be a part of it. The exhibition is also archived as VR online at https://my.matterport.com/show/?m=oJzKC5QnZD7&play=1&sr=-2.31%2C1.27&ss=185&fbclid=IwAR2hGBE9G9hobtApW65Rx1NIdvm1pMgugYWUjneO2KuzTxOrBPNFsmpHvZk
I gave an artist talk at DK Forum via Zoom following the exhibition, with a title “Data Art: Data as Artistic material and inspiration”. The talk is published in Youtube channel.

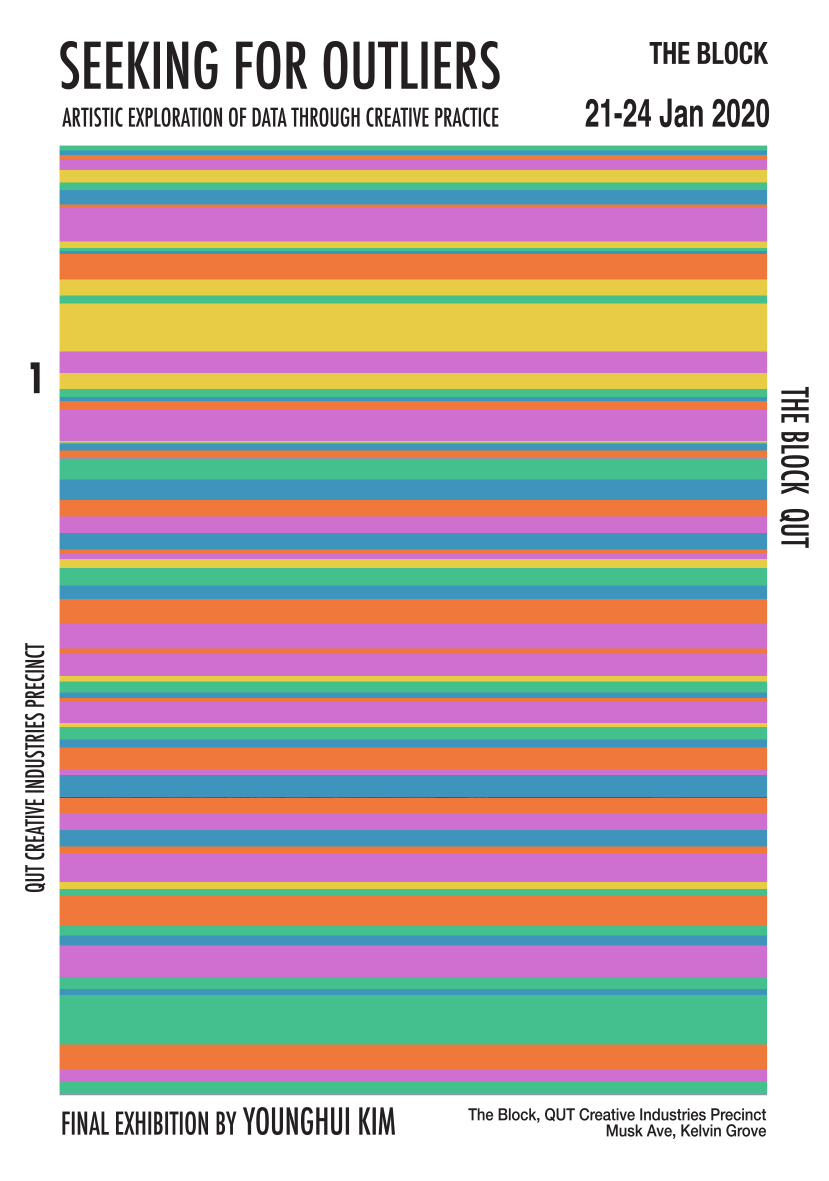
Seeking for Outliers: Artistic Exploration of Data through Creative Practice
The PhD Final Exhibition by Younghui Kim
아웃라이어를 찾아서: 창작에 의한 데이터의 예술적 탐구 – 김영희 (마리 킴)
21 of Jan – 24th Jan 2020: 10 am – 5 pm
at The Block, QUT Creative Industries Precinct, Musk Ave., Kelvin Grove
Opening Reception: Thurs. 23 Jan 2020, 5 – 7 pm
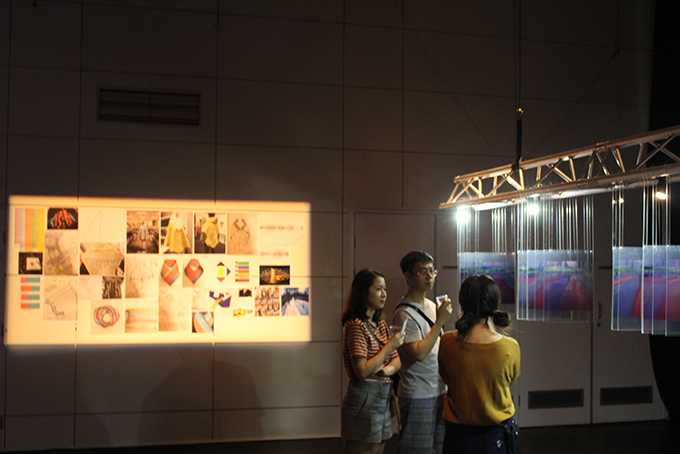
My PhD Final Exhibition was held at The Block gallery at QUT Kelvin Grove Creative Industries Precinct in Jan 2020. My long journey of practice-led research project was presented to the public as the exhibition, titled Seeking for Outliers. There were four sets of digital art installation that are data-driven. This followed The Sense of Data exhibition held at Platform-L, Seoul in 2018 with further developed artworks with an addition of a new work, Bridge Crossing.
“아웃라이어를 찾아서: 창작에 의한 데이터의 예술적 탐구” 라는 제목의 개인전이 27미터 x 12 미터 x 5 미터 높이 공간의 갤러리 더 블럭에서 2020년 1월에 개최되었다. 본 시리즈에서는 세트로 (e.g., 대형스크린과 데이터 드리븐 웨어러블 등) 이루어진 4점의 작품이 전시되었다. 2018년도 서울 플랫폼엘 컨템포러리아트센터에서 개최되었던 ‘더 센스 오브 데이터’ 개인전에서 좀 더 발전된 버전의 작품들과 새 작품 ‘Bridge Crossing’을 호주 브리즈번시의 대중에게 선보였다.
A video link to introduce this exhibition:
This exhibition is supported by Queensland University of Technology and Creative Industries Precinct.
Great Thanks to my spouse Sam and family in both Korea and USA, the kind staff Helena at Creative Industries HDR support group, Simon at J-Block (digital fabrication lab), Nigel and Blair at The Block, my colleagues at Urban Informatics Design Lab and most of all to my superb advisory team of: Dr Seevinck, Dr Payne and Dr Choi.
Younghui Kim (aka Marie) 김영희 (마리 킴)


