
Data As Art 2014
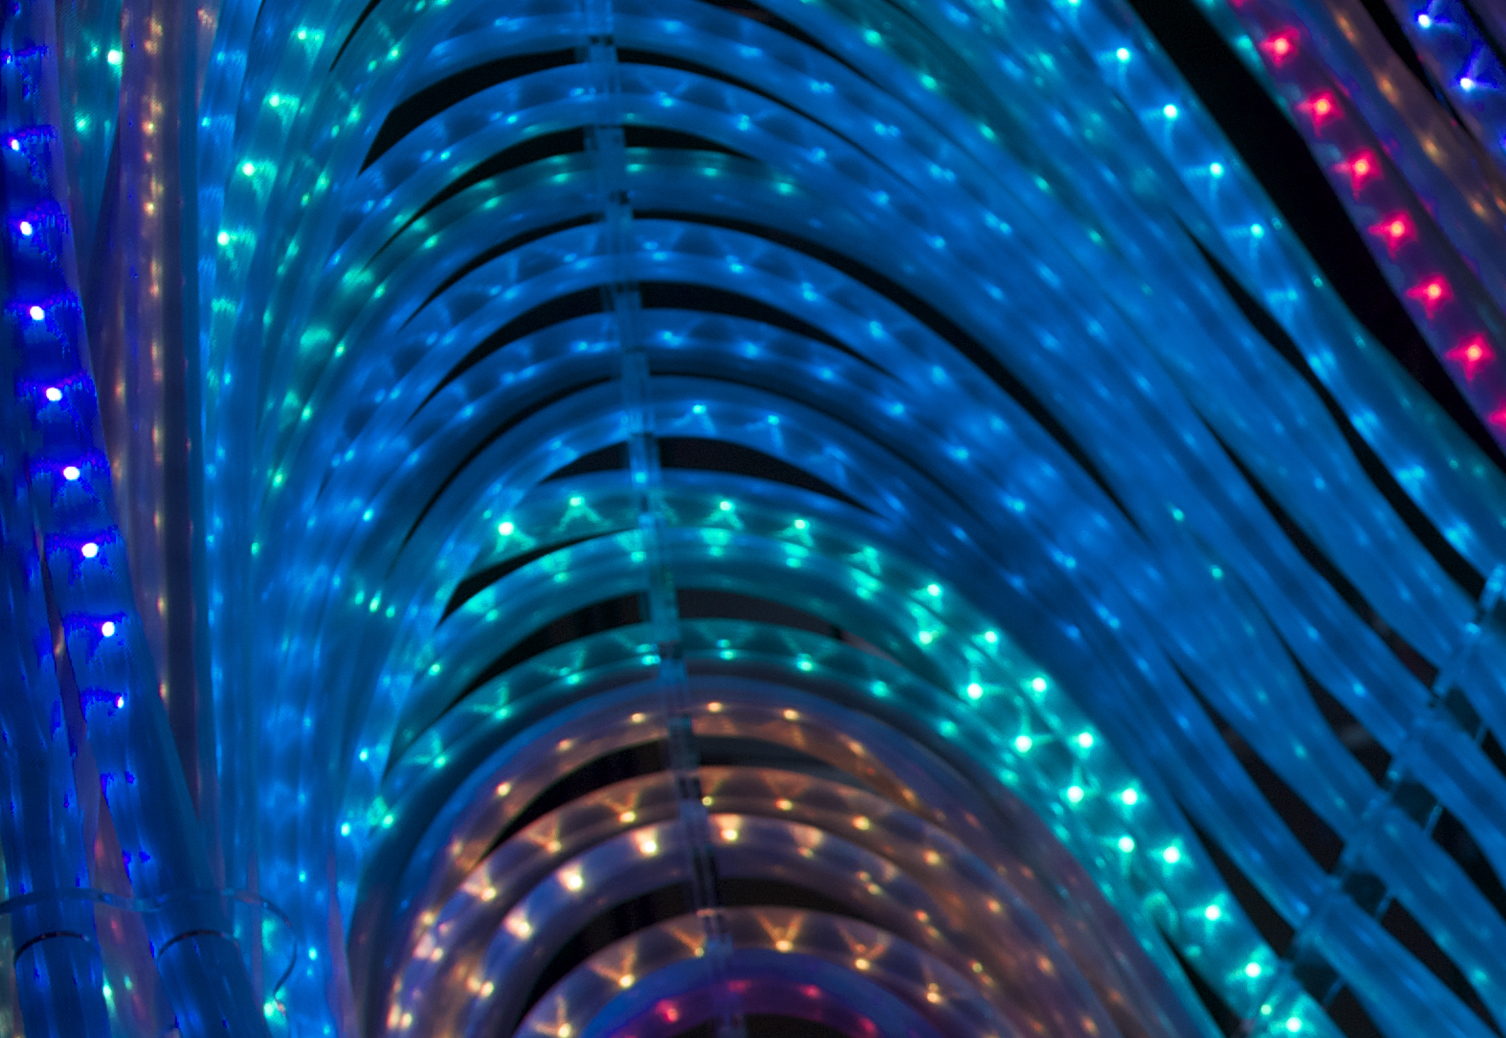
mood.cloud is an art installation in Gates Hall measures collective emotion in lighting.
artistic statement:
Emotional status is something that forms and passes like a cloud in the air. What if an installation can hold and collect individual emotional statuses and displays how we all feel together in the same space? Will collective emotional awareness influence individual moods and vice versa?
– Younghui Kim, Lead Artist

This interactive installation is a visual representation of collective emotional moods that are translated from PAM (The Photographic Affect Meter, JP Pollak, Phil Adams, and Geri Gay) input. The PAM is a one-click measure of emotional state now widely used in place of or in addition to traditional pen and paper psychological assessments.
This piece is an on-going collaborative research to see how these voluntary PAM inputs of building users would be relate to the visual representation of collected mood at a given timeframe. This mood.cloud platform can be re-programed in diverse visual patterns.

Here is a link that explains well about this research.
http://www.cis.cornell.edu/data-art
Below is some of the article exerted:
For as long as it’s been around, people have used lighting to set a certain mood. But now researchers at Cornell are using light to measure mood.
The result is a fun, interactive art installation in the atrium of the new Bill & Melinda Gates Hall called the “mood cloud.” It was developed and constructed by Cornell’s Interaction Design Lab (IDL), and is headed up by Information Science Professor Geri Gay and postdoctoral researcher Lindsay Reynolds. “The first installation we’re doing is an emotion meter,” says Gay. “We call it data as art.”
“This project exemplifies the interdisciplinary nature of CIS, and is a perfect example of the way people work today, by bringing together various talents and disciplines.”
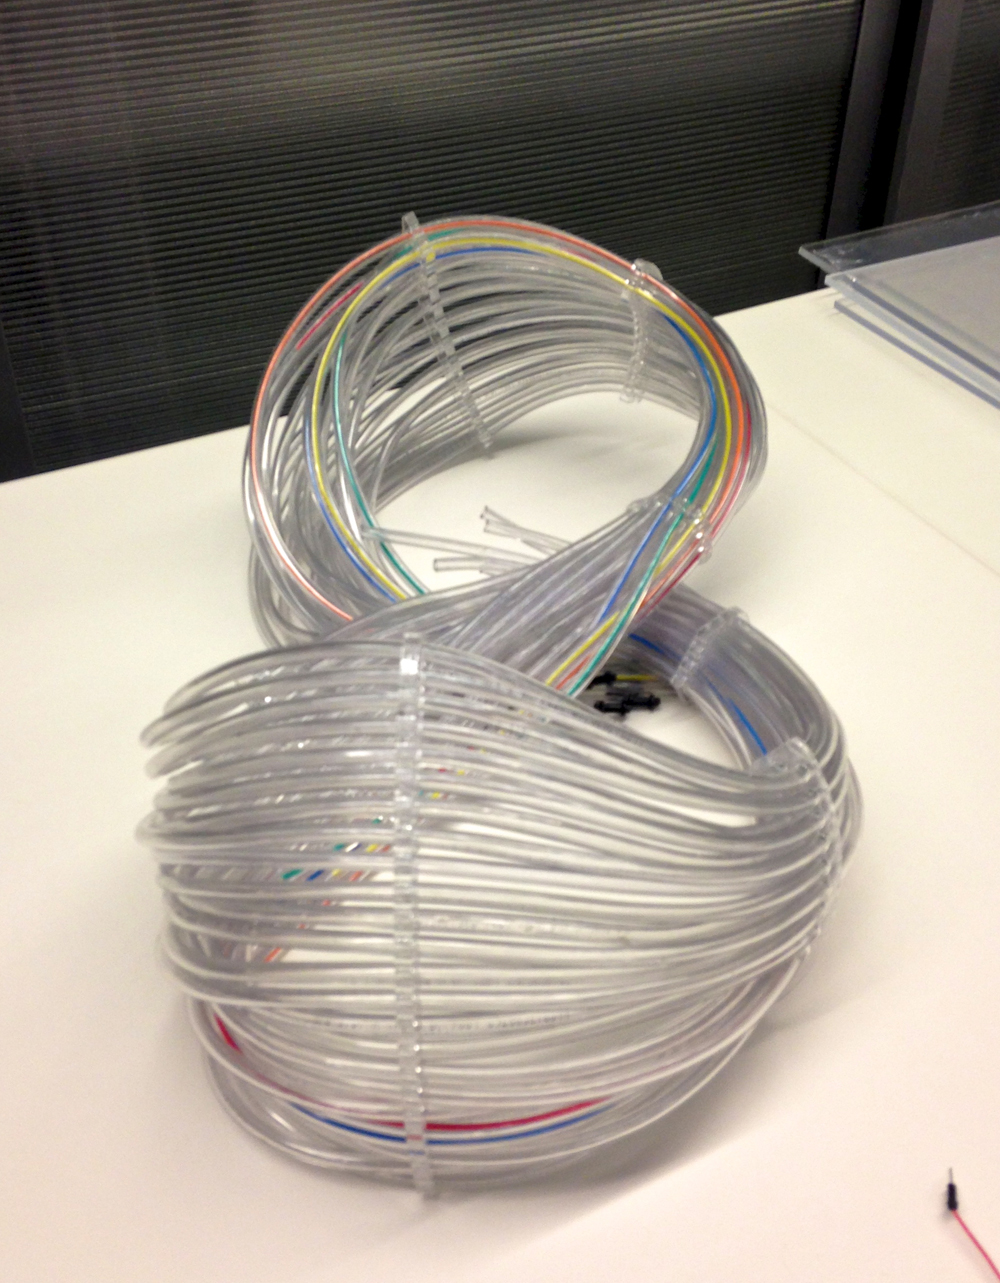
Here is how it works. An iPad touchscreen shows a collection of images that correspond to emotions, such as cuddly kittens or serene landscapes. You tap on the image that best captures your mood. An algorithm then translates it to a color, which is displayed in an LED light string from a suspended acrylic sculpture. Feeling happy? Tap on the smiley face and your string lights up yellow. Feeling blue? Tap on a rainy photo, it turns dark blue or black. Up to 24 people at a time can enter an image, turning the mood cloud into a “mood crowd” that captures collective emotions across an array of 16 colors. But Gay says the applications for the research in capturing sentiment are much broader. For instance, it could also incorporate Twitter feeds “to capture the mood of the world.”
The hanging sculpture was designed by visiting Korean artist, Younghui Kim, a specialist in new media art. Its installation was a collaborative effort involving Cornell artists, computer programmers, social scientists and environmental architects. Gay says, “This project exemplifies the interdisciplinary nature of CIS, and is a perfect example of the way people work today, by bringing together various talents and disciplines.” —- please click on link to read further.

One thought on “mood.cloud – data as art 2014-15”